Geography Meets Innovation: Insights from Our Hackathon Experience, 19th November 2024
T he devastating impact of Tropical Cyclone Freddy on Southern Africa in 2023 (from February - March) highlighted the urgent need for innovative solutions in disaster management. In Malawi alone, over 500 lives were lost, thousands were displaced and communities struggled to rebuild amidst widespread flooding. While established disaster response methods are crucial, they can be slow or limited in their ability to respond to rapidly evolving crises. During the flooding, social media platforms like WhatsApp, Twitter, and Facebook became vital channels for real-time data sharing, providing an untapped opportunity to bridge these gaps. By leveraging social media data, we can enhance the speed and effectiveness of flood mapping and disaster response efforts, ensuring a more responsive and informed approach to future disasters.
Recognizing this potential, we participated in the 2024 Geography Awareness Week Hackathon under the theme "Mapping Minds, Shaping the World." The event brought together developers, researchers, and mappers to explore how social media feeds could be harnessed to create structured systems for flood mapping. With the devastation of Cyclone Freddy serving as our problem statement and motivation, our mission was clear: to collaboratively design a solution that integrates data from social media into disaster management frameworks, leveraging tools like OpenStreetMap and AI technologies.
What followed was an inspiring day of brainstorming, coding, and problem-solving. We divided ourselves into three teams based on individual areas of expertise, with everyone free to choose which group they wanted to participate in. Each team had a designated leader to guide the process and ensure smooth collaboration. Below is an outline of the tasks each team was assigned to work on during the hackathon:
Team 1: User Interface and Project Development
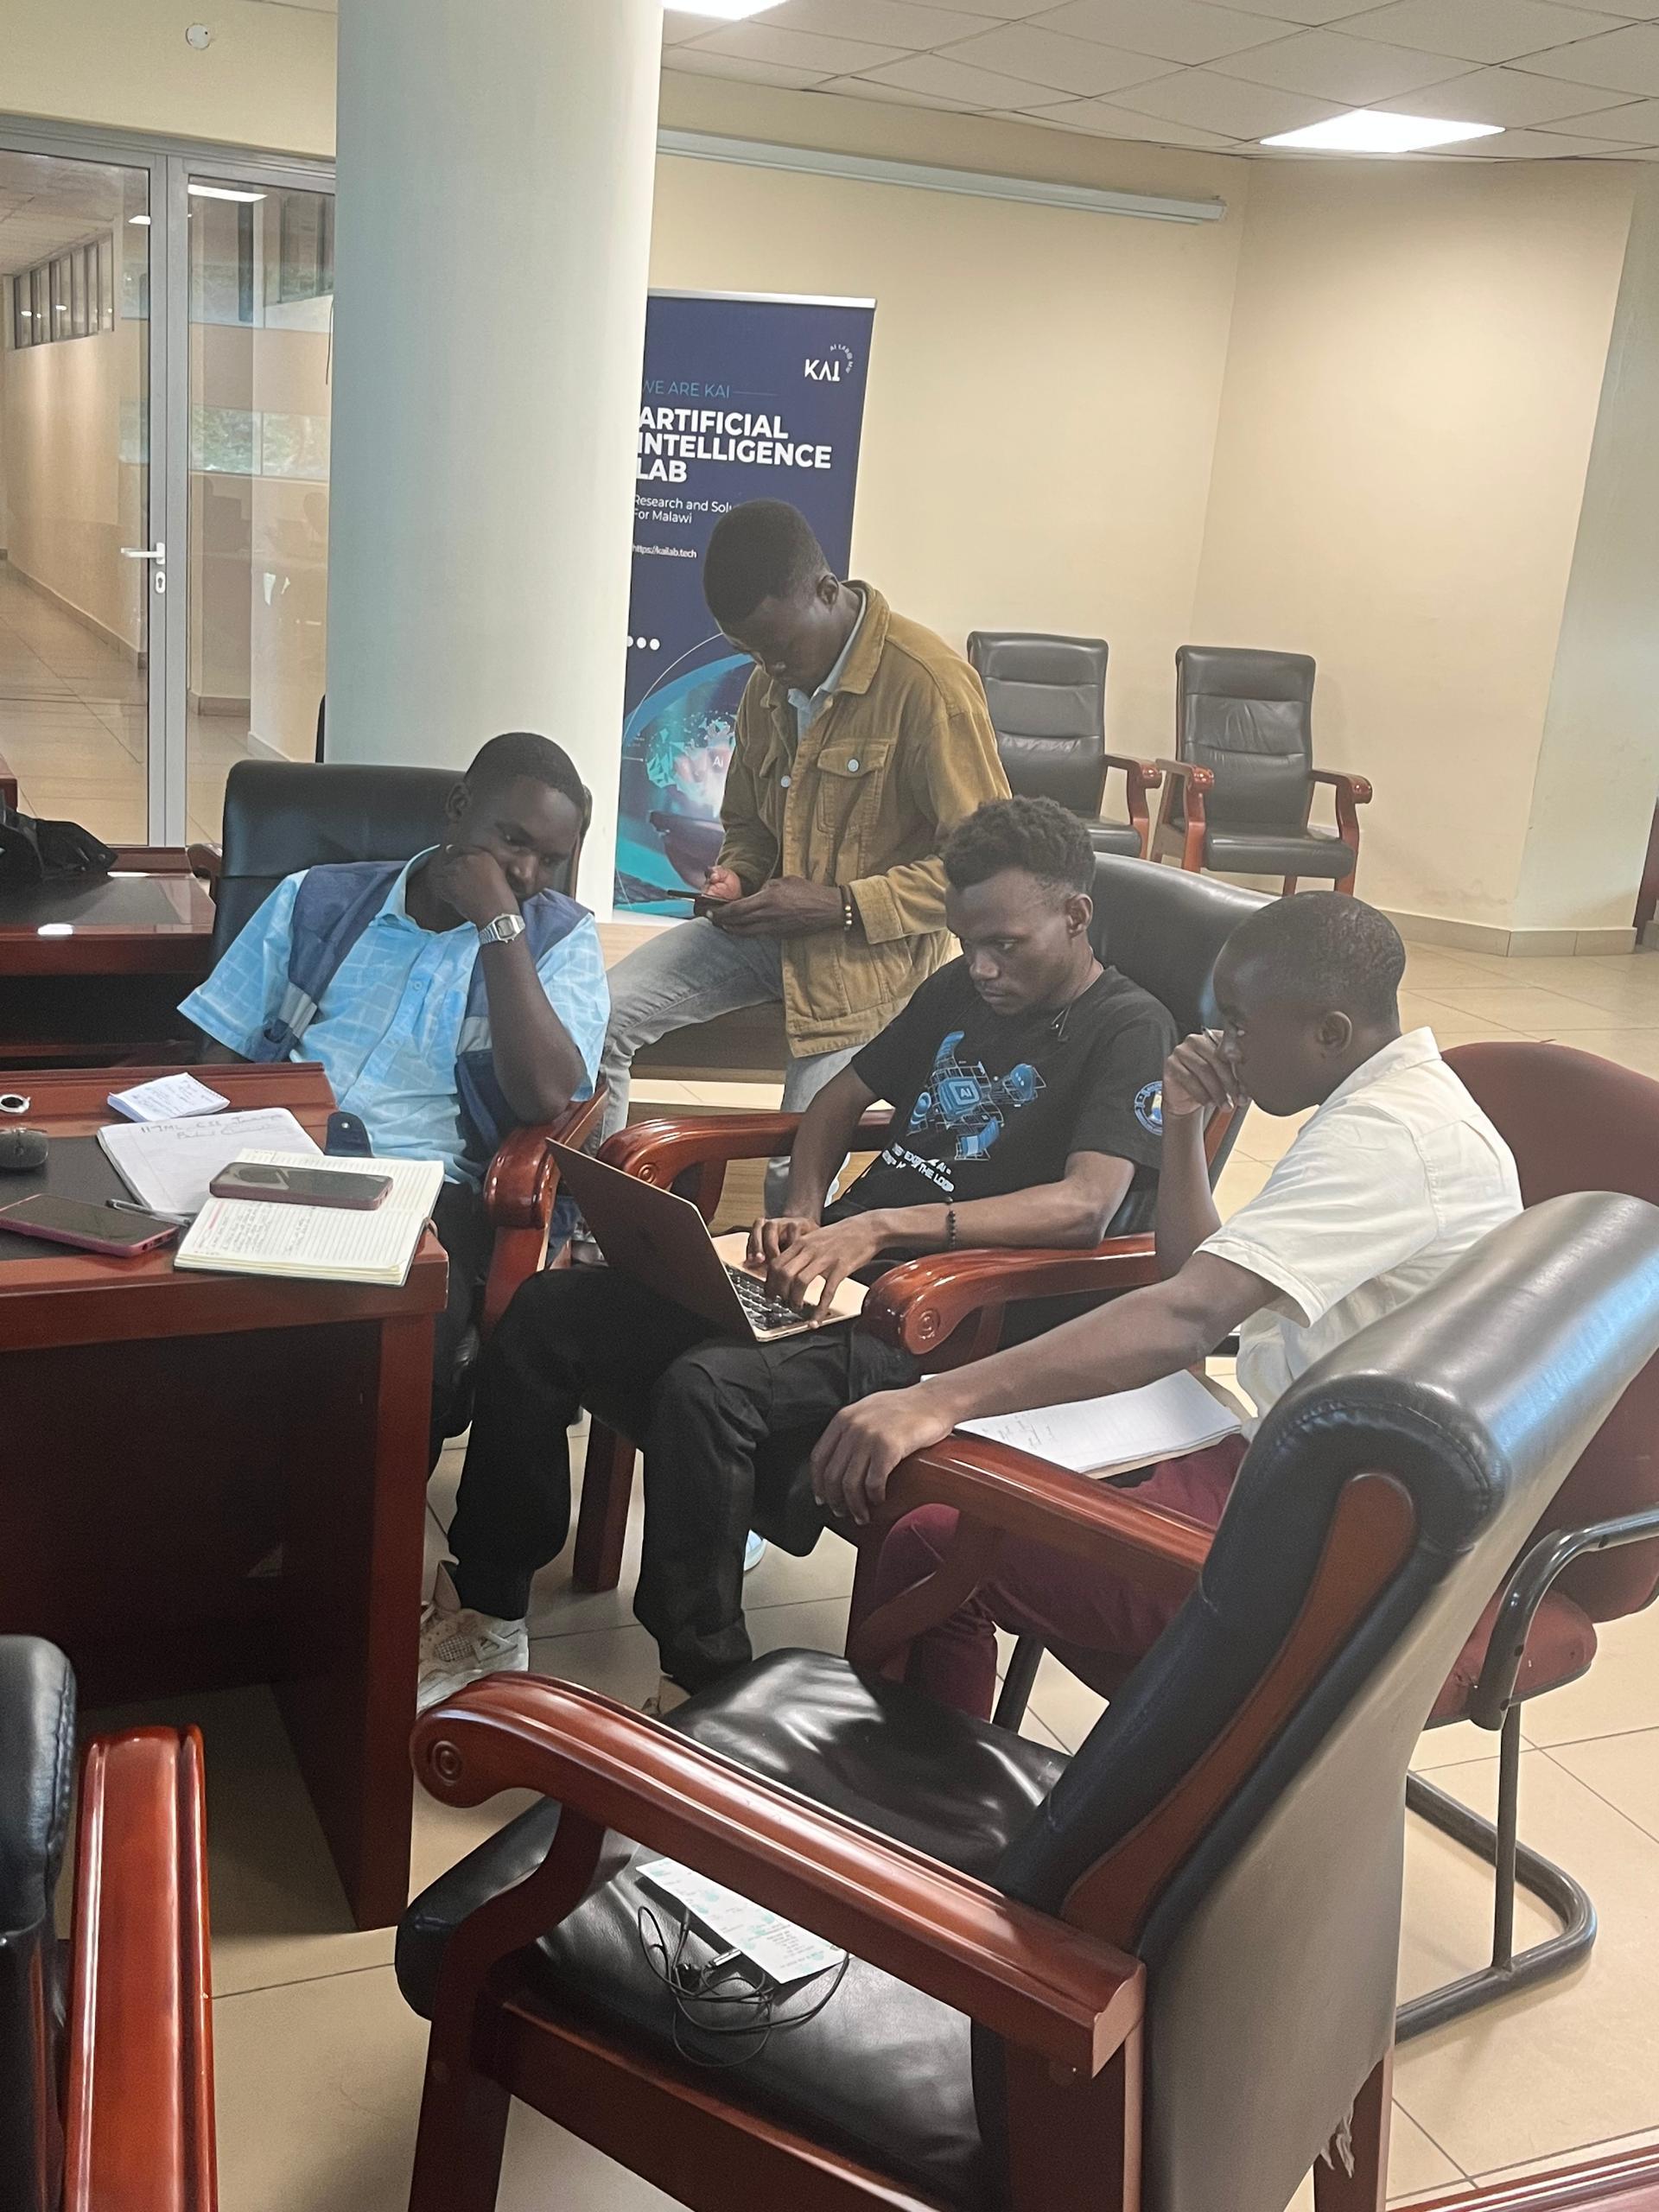
The first team was tasked with building the core structure of the project. Their focus was on developing a user-friendly interface that would allow for account creation, with affiliation as a required field. They were also responsible for structuring the project to transition through three key stages:
- Harvesting – Collecting social media posts related to flooding events.
- Filtering – Ensuring that the collected posts met eligibility criteria, such as including images.
- Mapping – Organizing the filtered posts and creating a visual map of the flooding data for analysis.
Team 2: Data Filtering and AI Model Development
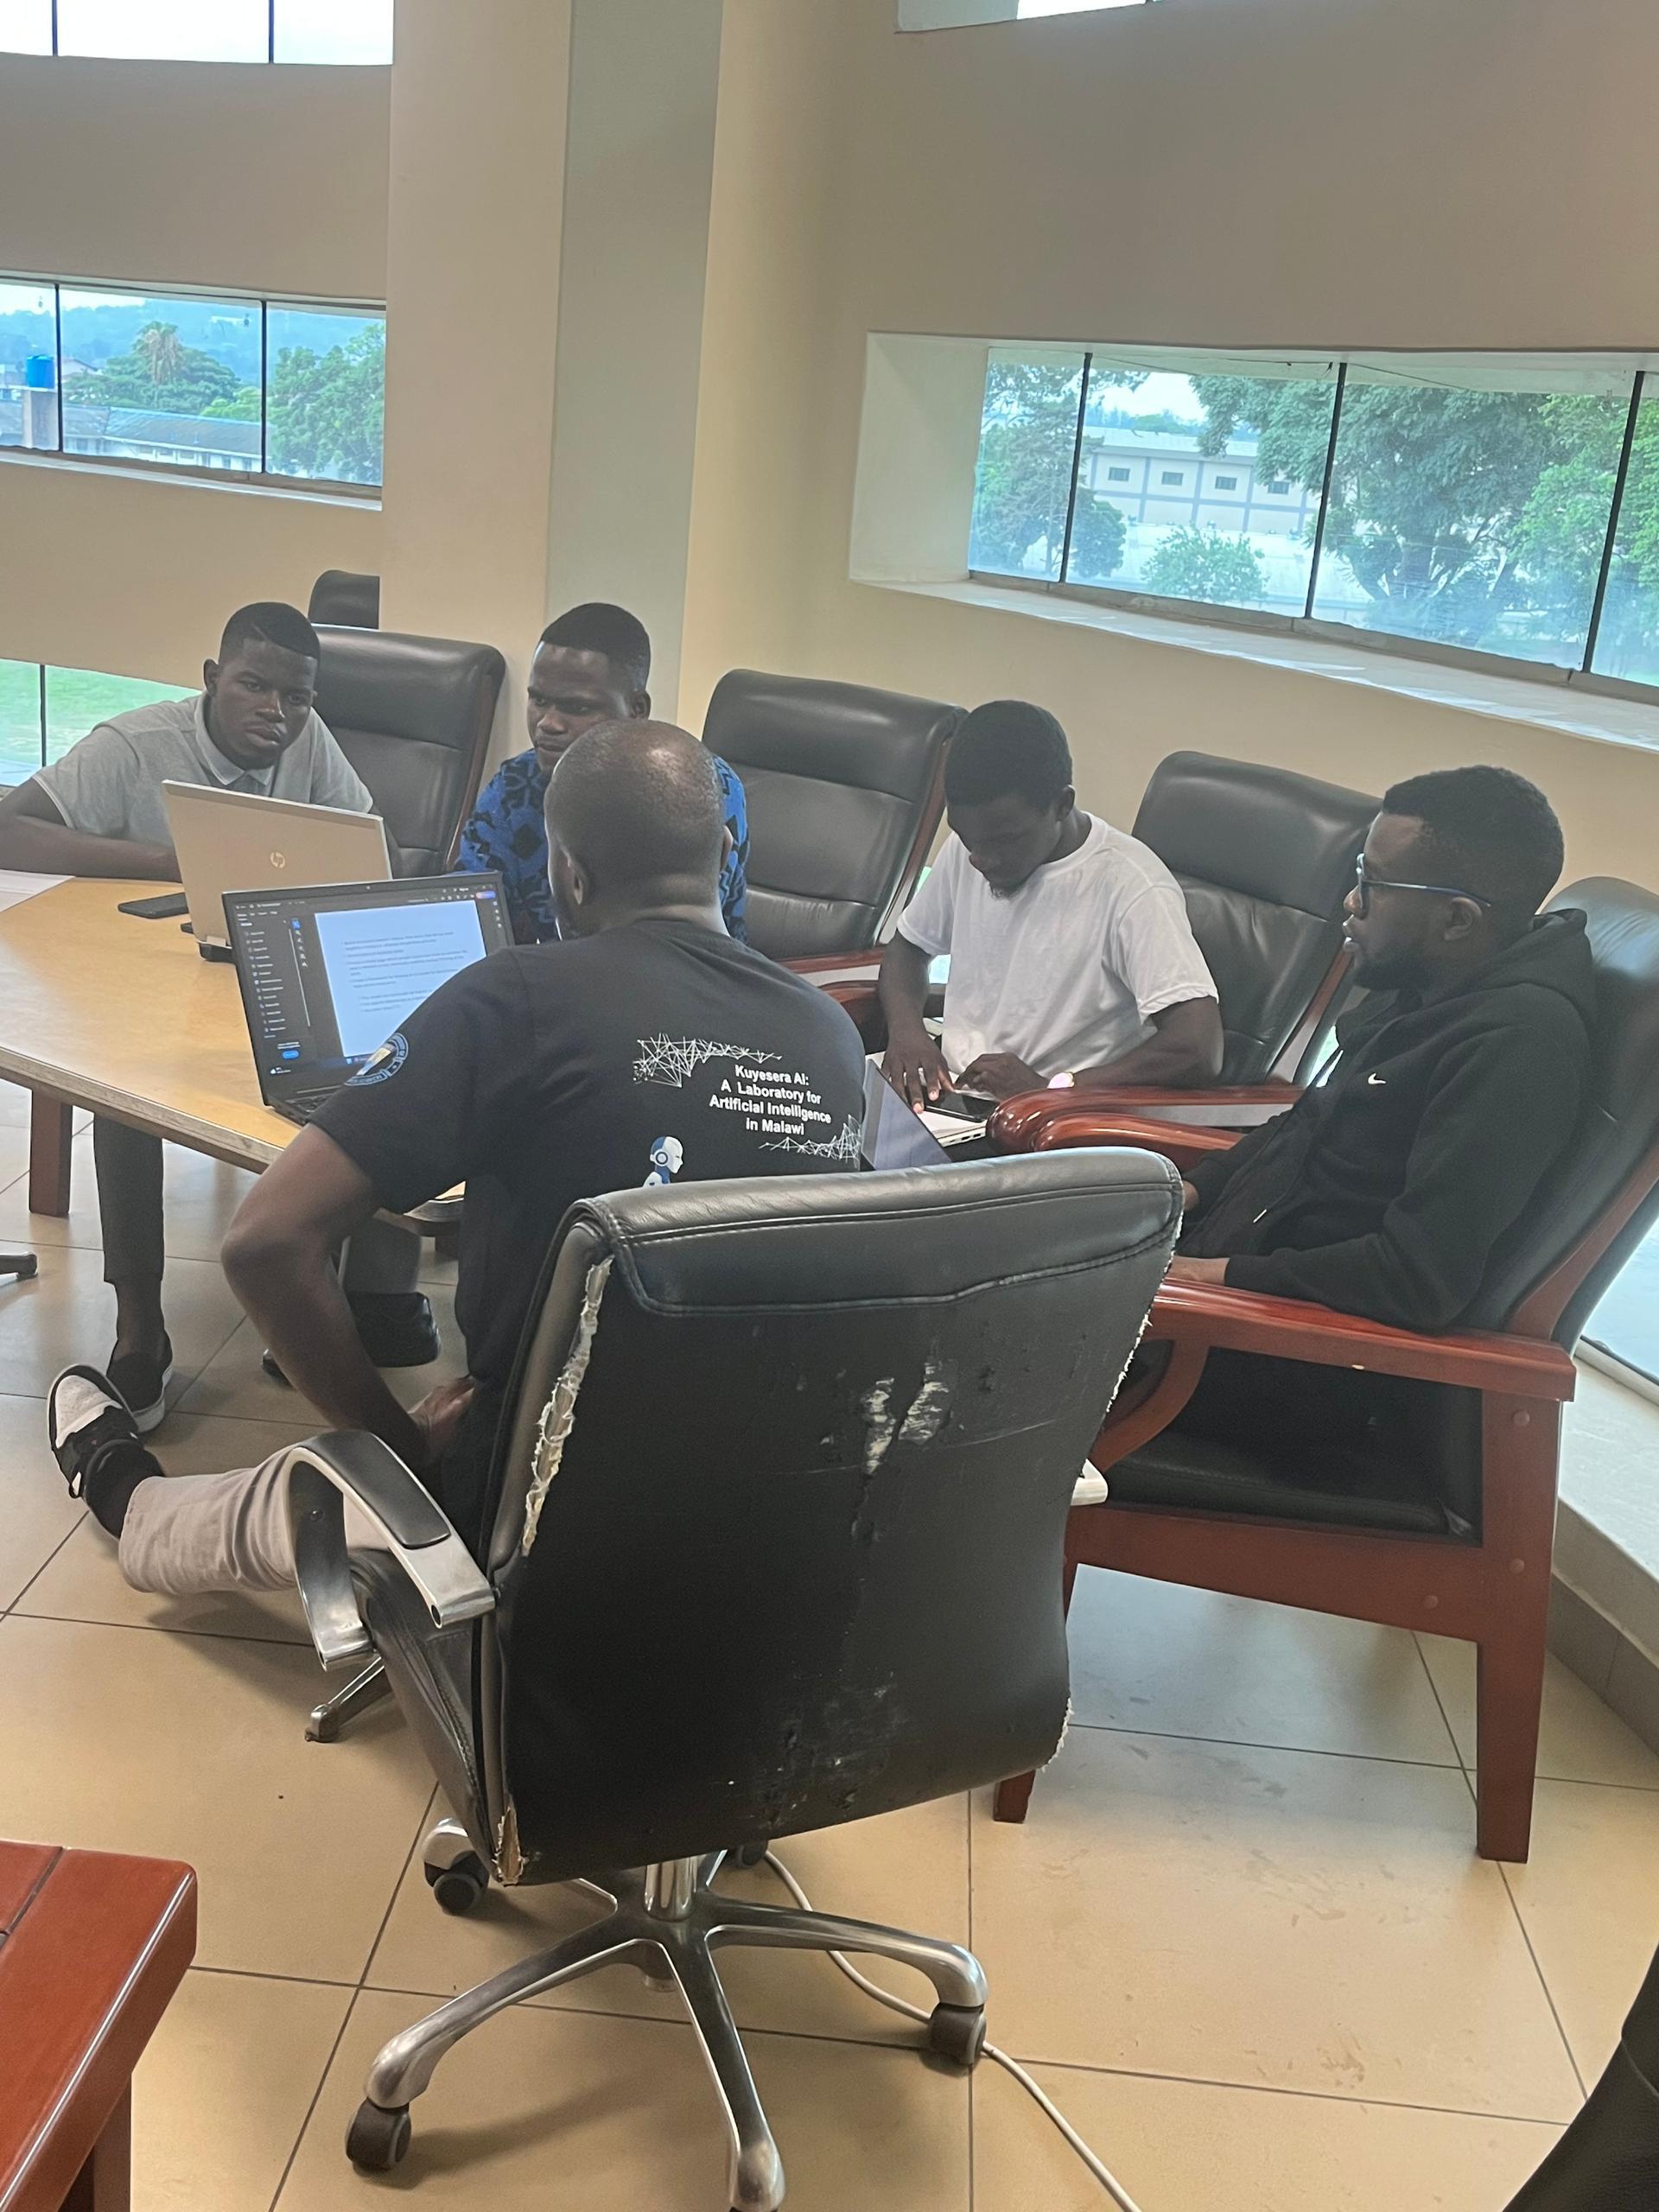
This team’s focus was on filtering the social media data to ensure it met specific criteria. They were tasked with filtering out posts that did not meet the required standards, such as posts without images. In addition, they were asked to identify duplicate posts to avoid redundancy. Their role also included creating a simple page where users could manually mark posts as relevant or not, aiding in the manual filtering process. Additionally, this team worked on laying the groundwork for developing an AI model to automatically filter out off-topic posts, with the goal of continually training this model as new data was collected.
Team 3: Mapping and Location Automation
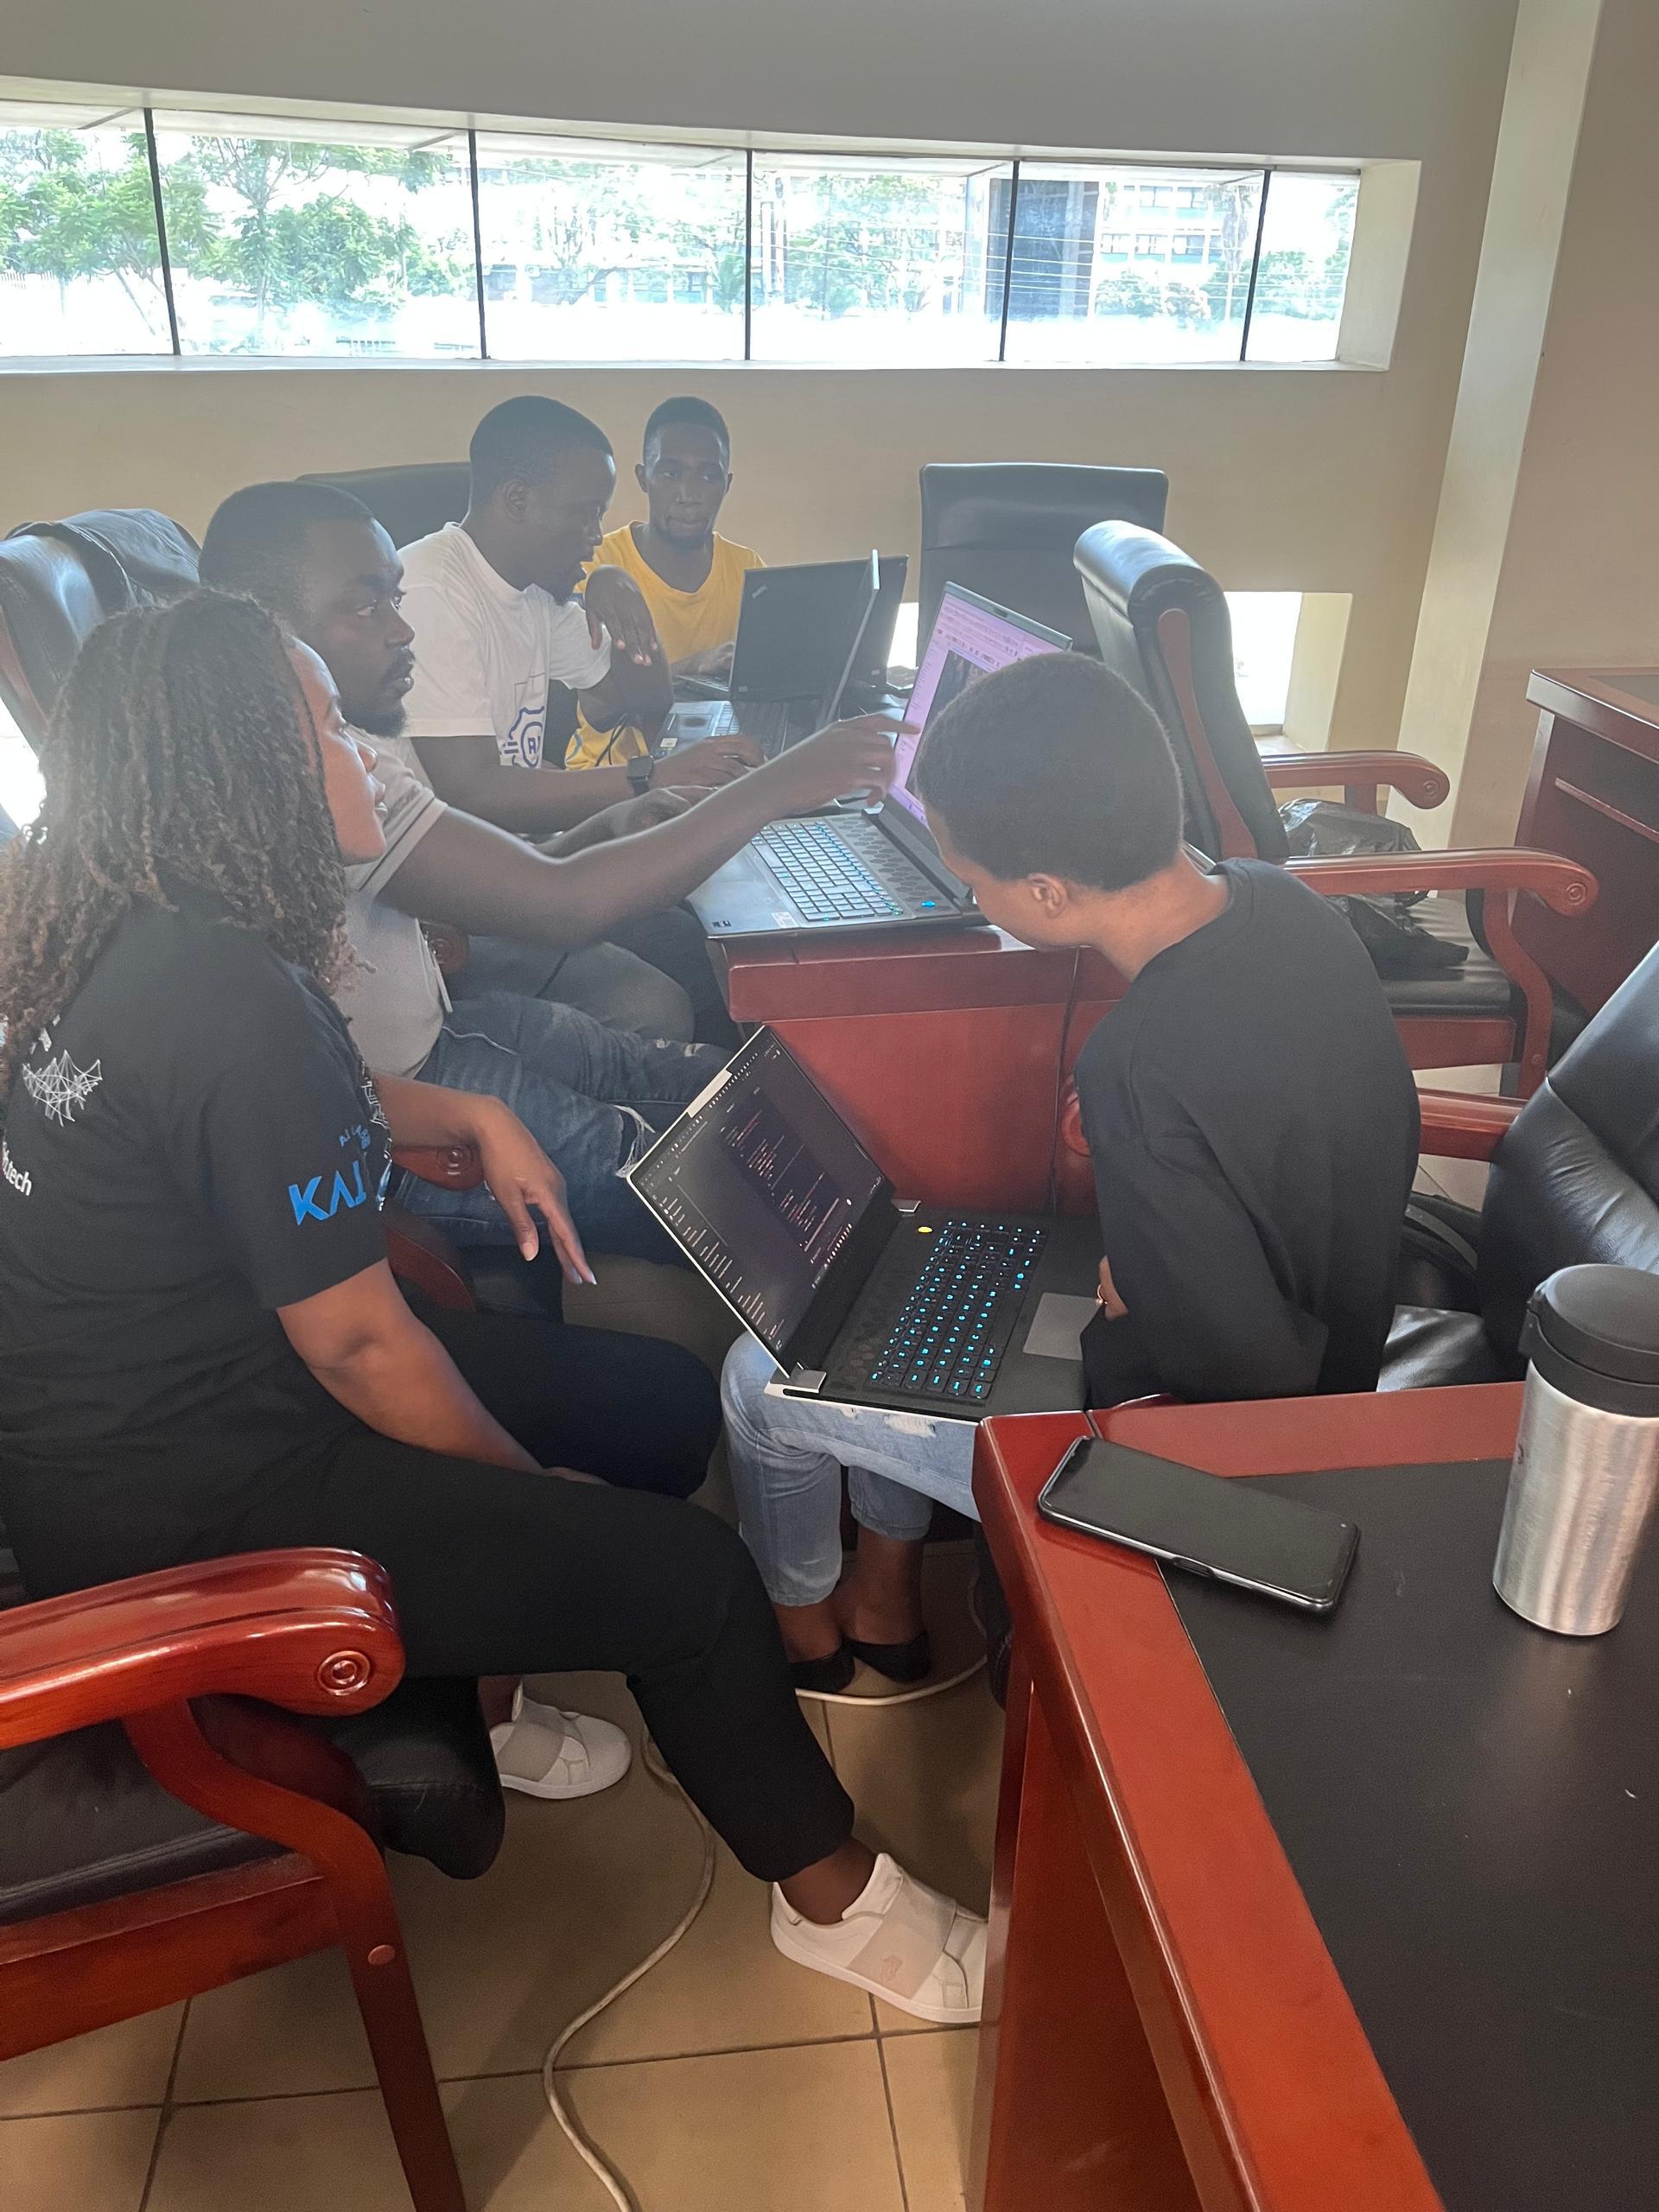
The third team was responsible for mapping the filtered social media posts by identifying their actual locations.They explored the use of geographic tools that could automate the process of linking images to specific locations, leveraging an already available dataset of social media posts from Nkhotakota dwangwa floods. Their task also included using Natural Language Processing (NLP) to aid in extracting geographic details from the posts, and cross-referencing them with platforms like Google Maps or OpenStreetMap to determine the exact coordinates of the flooding events.
Turning Vision into Reality: Our Achievements in One Hour
After dividing ourselves into teams and setting clear objectives, we gave ourselves one hour to achieve the tasks. Despite the limited time, we made impressive progress on our goals. Here's a look at what each team was able to accomplish during the hackathon:
Team 1: User Interface Development
The first team worked diligently to lay the foundation for the project’s user interface. By the end of the hour, they had successfully developed a landing page, sign-in page, login page, and project page. Although the time constraint limited the scope of their work, the team managed to create the core structure needed for user interaction and project navigation. This solid starting point will enable further development and refinement in the future.
Team 2: Data Filtering and AI Model Development
Team 2 focused on defining relevance and filtering out irrelevant data. They established clear criteria for what constitutes relevant content, such as the inclusion of images, location-specific details (e.g., landmarks), and time stamps. Additionally, they developed key terminology for identifying flood impacts, actions taken, community engagement, and flood-prone areas in Malawi.
To put this work into practice, the team generated 150 records of non disaster context using ChatGPT, and merged it with an existing dataset containing 167 disaster records. They then trained a random forest model for text(record) classification, though the model’s performance was less than optimal due to a few challenges:
- Less data
- Poor quality of the augmented data
- Selection of the most appropriate model for text classification
Despite these issues, the team gained valuable insights into improving the model’s performance and had a clear path forward for fine-tuning their approach.
Team 3: Mapping and Location Identification
Team 3 focused on mapping the images and text from the Nkhotakota and Dwangwa flood datasets. They had a dataset of 33 images and using satellite imagery, they manually identified 16 images from the 33 suitable to be used for mapping, they manually pinpointed the locations of these 16 images. However, the team faced a challenge in obtaining longitude and latitude coordinates, as the required API cost $300, which was beyond their budget.
They also explored alternatives like Esri which can be used for extracting geographic details from the text accompanying the posts. By analyzing keywords such as "Dwangwa" and "madzi osefukira ku Dwangwa," they identified potential flood locations and used Google to verify their existence. While they couldn’t complete the entire process within the hour, the team also made progress on developing an algorithm that could automate this mapping process in the future.
Team 3 discovered two promising approaches for future flood mapping:
- Using images to identify flood locations.
- Using text and keywords from social media posts to pinpoint areas affected by flooding.
In conclusion, the hackathon was a remarkable exercise in collaboration, problem-solving, and innovation. While we couldn’t achieve what we hoped to within the short timeframe, the progress made was significant. Our work during the event laid a solid foundation for future development of a comprehensive flood mapping system using social media data. With these insights, we are one step closer to developing a more efficient and responsive disaster management framework, capable of leveraging real-time data for better flood mapping, quicker responses, and ultimately, a more resilient future.
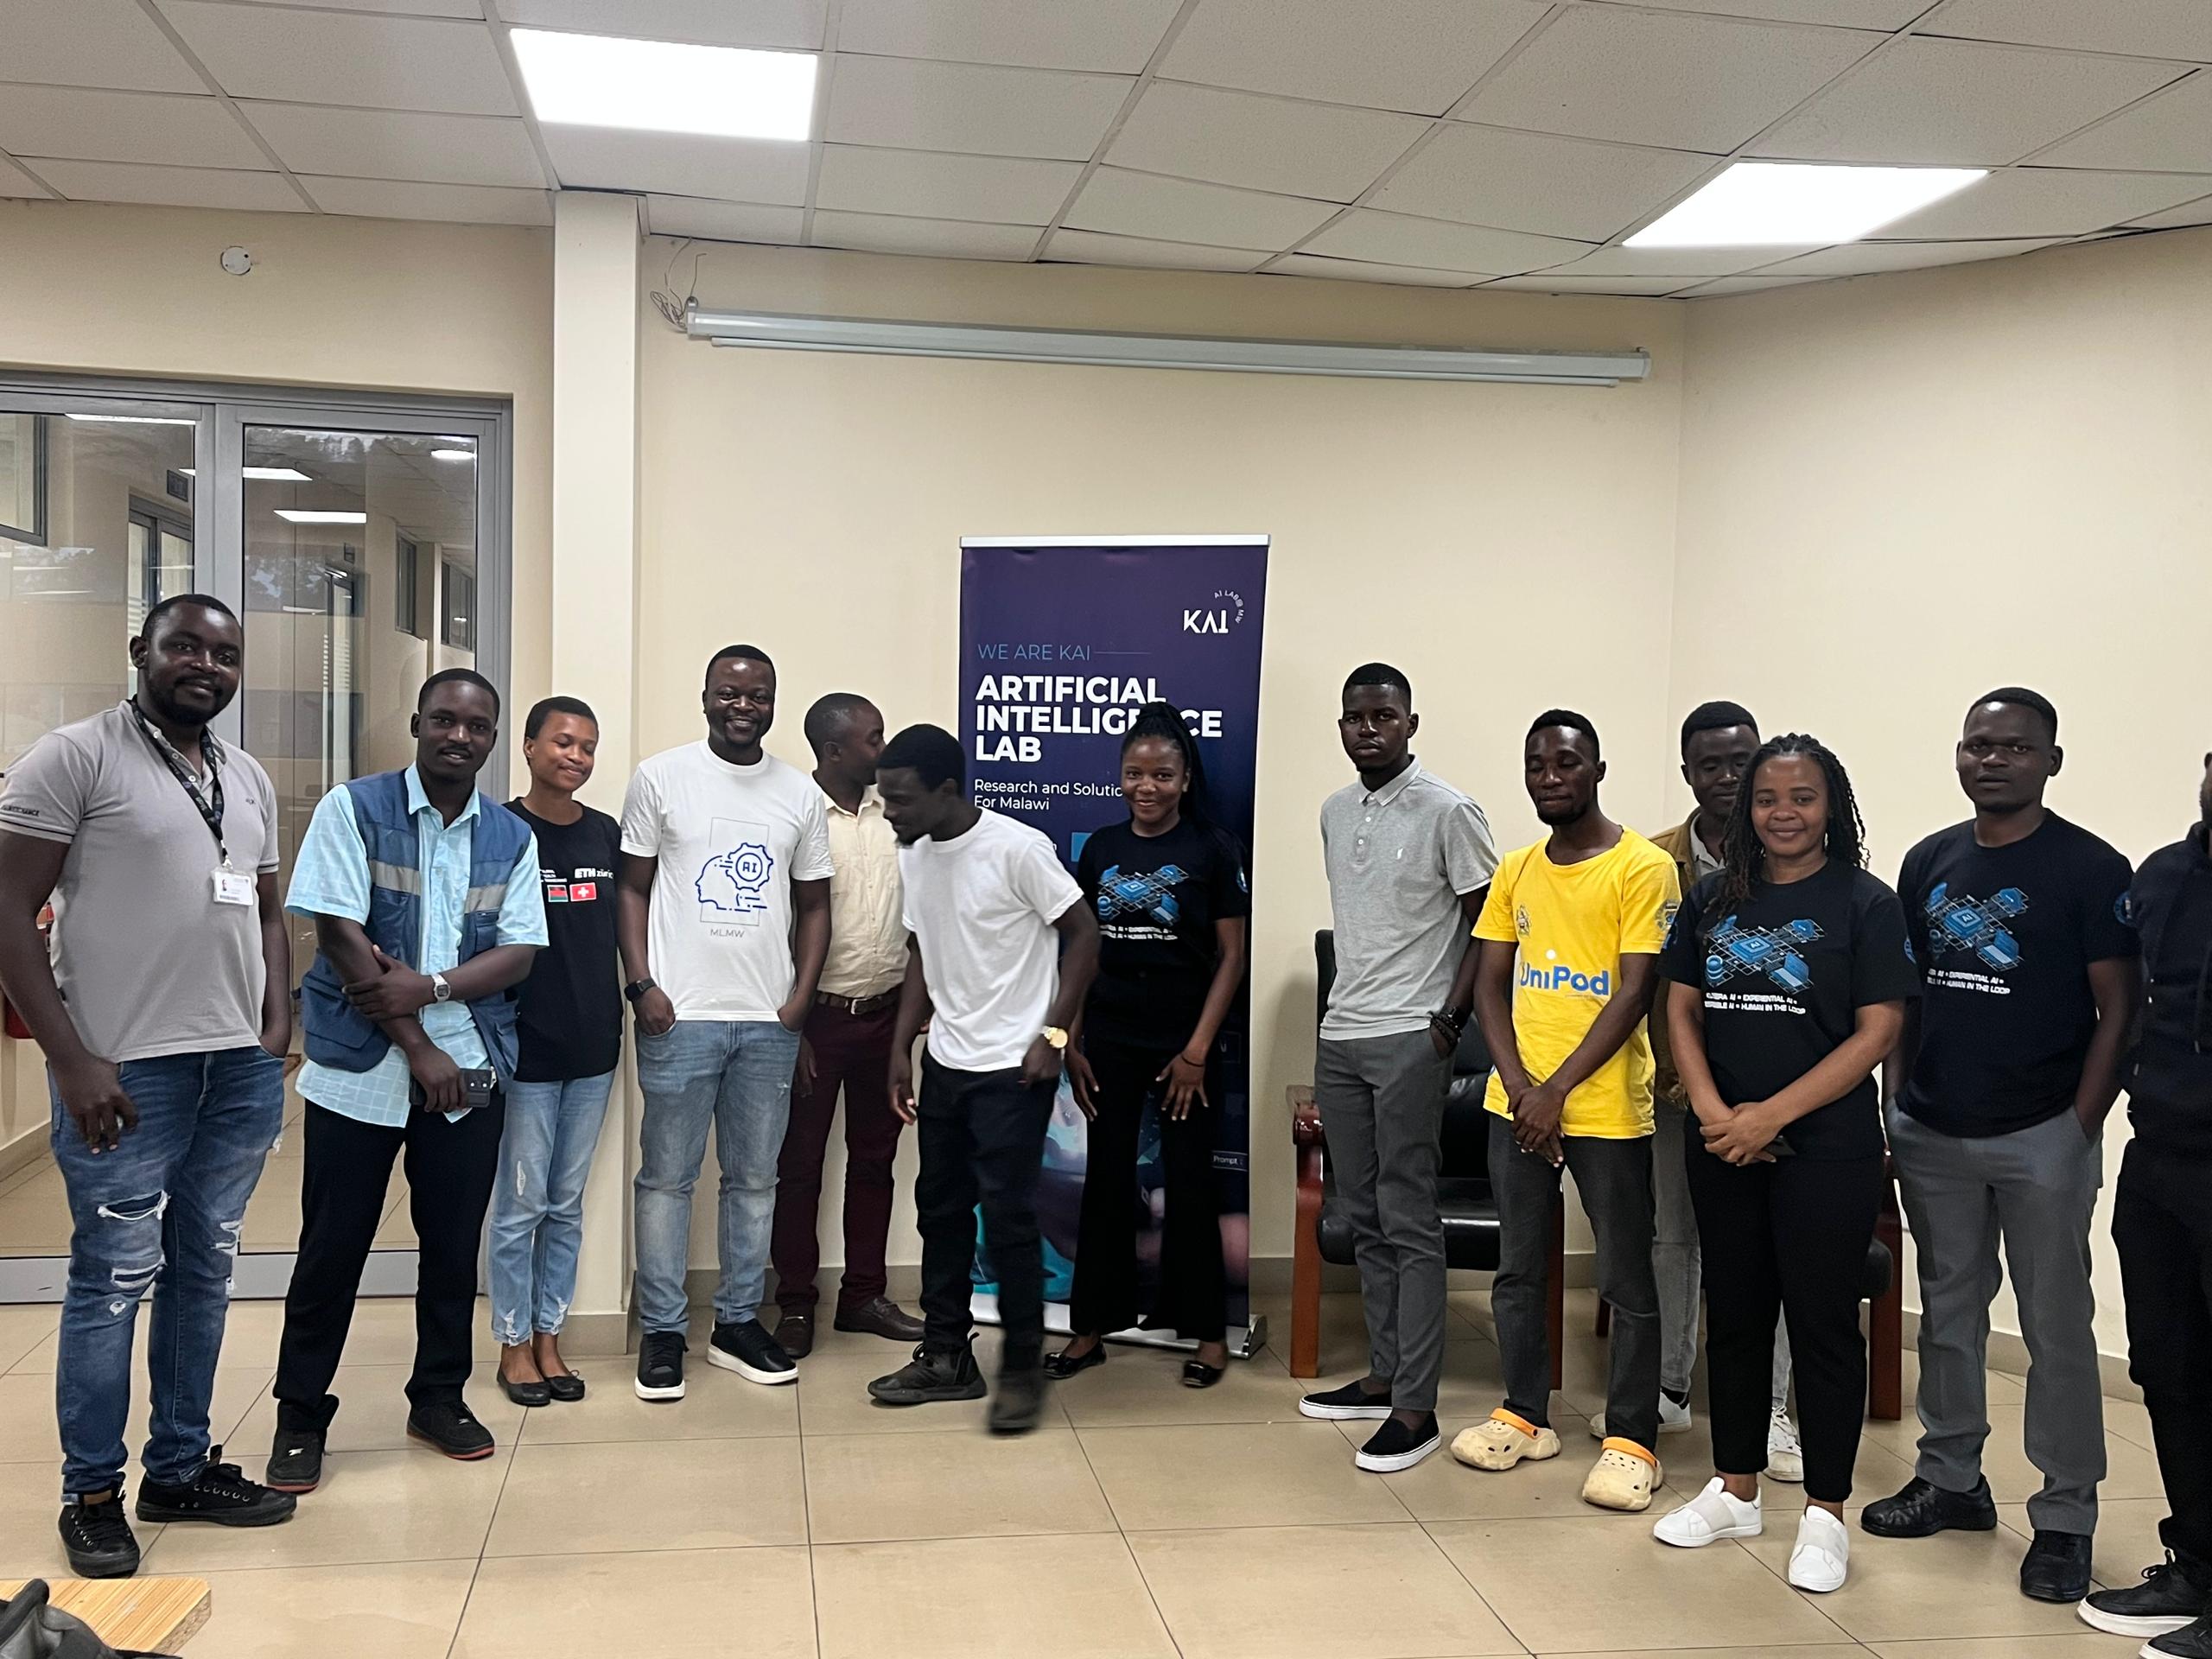 A group photo from the hackathon
 KAI LAB